
Example: dashboards for a loan company
תוכן זה אינו זמין עדיין בשפה שלך.
Tidewell Lending, a fictional loan company, runs its whole loan process on Cellosign. A customer applies online, a loan officer reviews the application, a credit committee approves the big loans, the customer and a guarantor sign, operations transfer the money, and the customer rates the service.
Every step of that process also feeds the dashboards. Nobody exports a spreadsheet or updates a status by hand: management sees the pipeline, each loan officer sees the applications waiting for them, the committee sees its queue, and operations see what to transfer. All from the same data, at the same moment.
How the data travels
Section titled “How the data travels”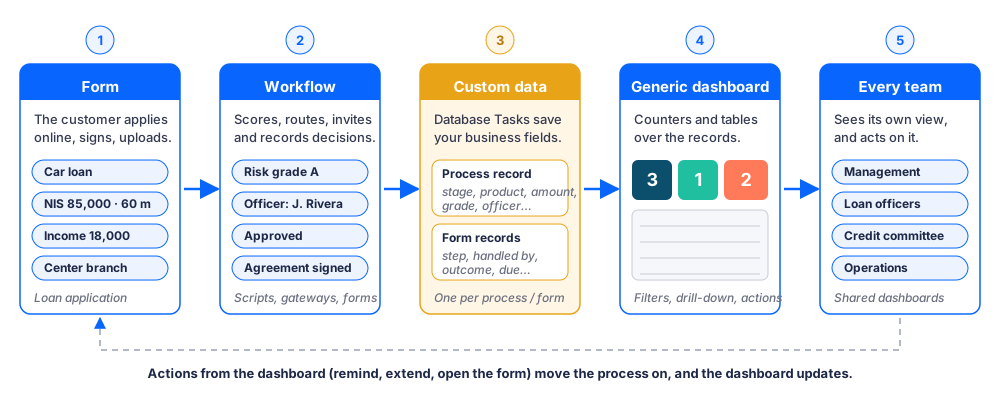
- The form collects the facts. The customer fills in the loan application: the product, the amount and term, the income, the branch, how they heard about Tidewell.
- The workflow adds what nobody types. A script calculates a credit score, the risk grade and the debt-to-income ratio, assigns the loan officer of the branch, and sets a decision deadline. Gateways send big or risky loans to the committee.
- Custom data keeps it all in one place. After each step, a Database Task writes the business fields to the process’s custom data record: the stage, the decision, the approved amount, the rate. Each form also gets its own record: which step it is, who handles it, the outcome.
- Dashboards read the records. Generic widgets count, list, filter and sort the processes by any of those fields, and show the forms of each one.
- Teams act from the dashboard. Send a reminder, extend a form, open the form to fill it in. The process moves on, and the dashboards follow.
The process
Section titled “The process”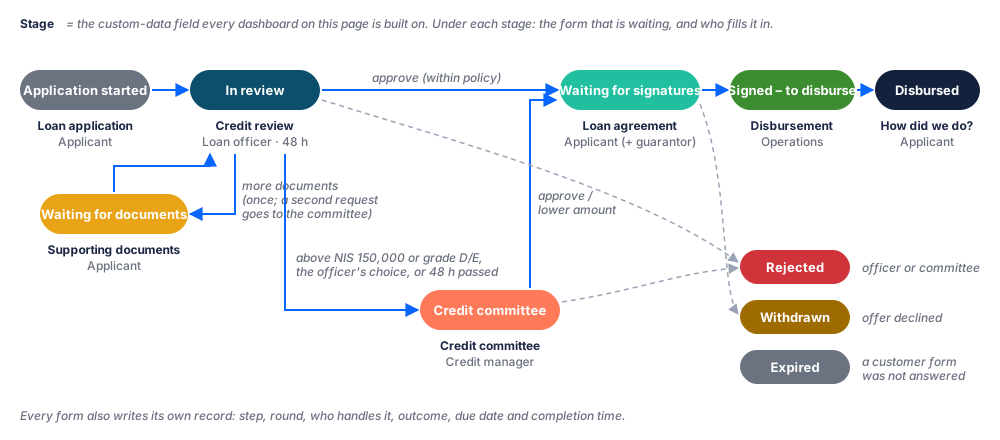
The stage is the heart of the dashboards. The workflow sets it at every step, so a counter with the filter “Stage is any of In review” always shows how many applications wait for a loan officer.
| Form | Who | What it adds to the data |
|---|---|---|
| Loan application (public link) | The customer | Applicant, customer type, employment, income, product, amount, term, guarantor, lead source, branch |
| Credit review | Loan officer of the branch | Decision, approved amount, rejection reason; a request for documents; or a referral to the committee |
| Supporting documents | The customer | Payslips and bank statement; back to the review |
| Credit committee | Credit manager | Decision on loans above NIS 150,000, risk grade D or E, referrals, and reviews not done within 48 hours |
| Loan agreement and Guarantee deed | The customer and the guarantor | Signed or declined |
| Disbursement | Operations | Transfer reference and date |
| How did we do? | The customer | Satisfaction from 1 to 5, would they recommend Tidewell |
One record, many views
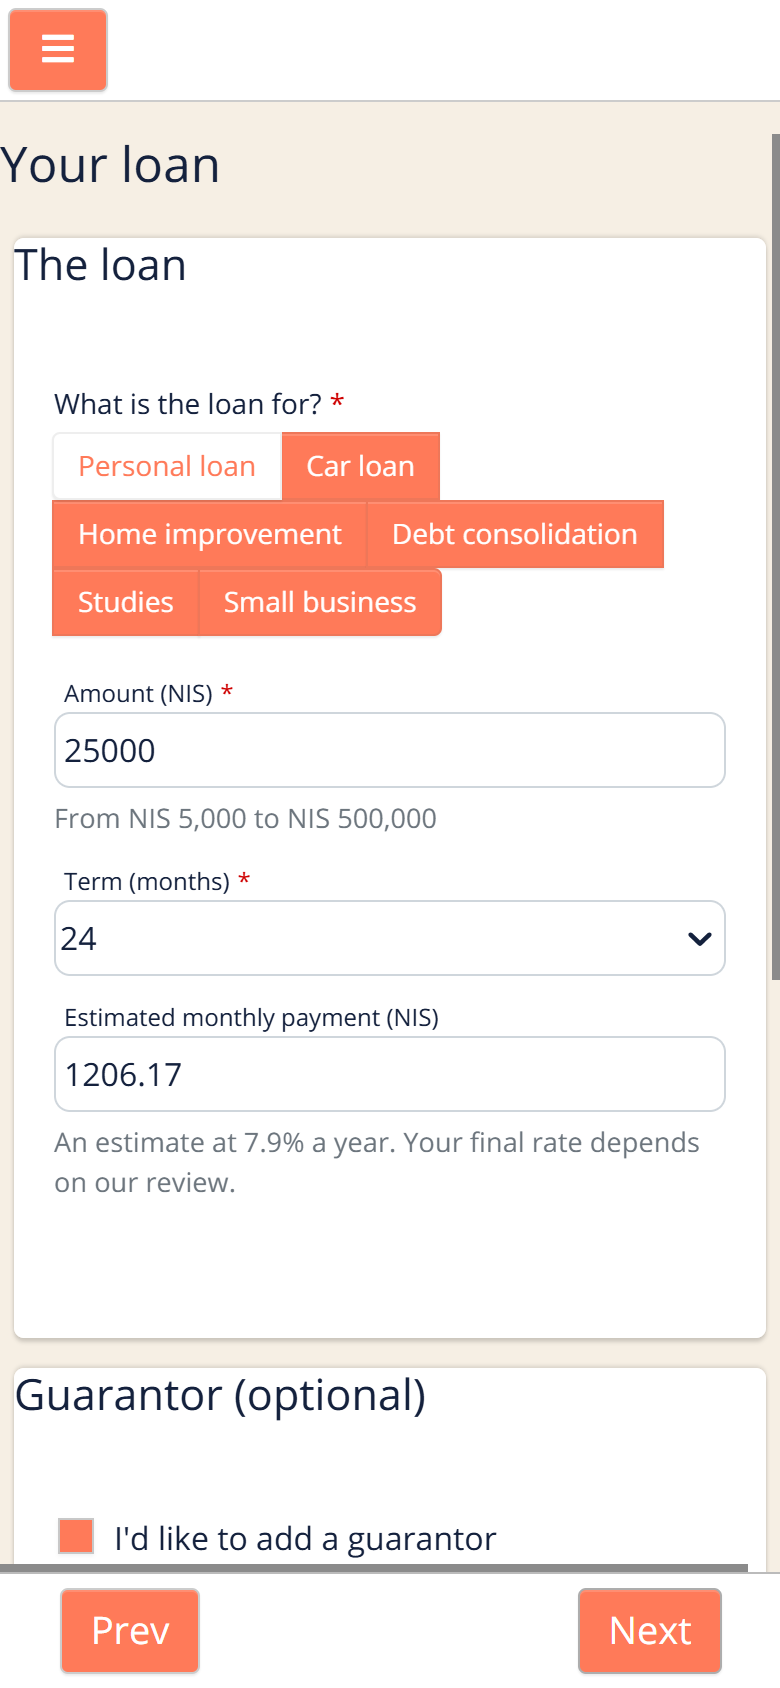
Section titled “One record, many views”This is how a few fields travel from the form to the dashboards:
| In the form or the workflow | Custom data column | On the dashboards |
|---|---|---|
| “What is the loan for?” (buttons) | Loan product | A column and a filter in every table |
| Amount and term | Requested amount, Term (months) | The committee queue, sorted by the largest amount |
| Script: score and debt-to-income | Credit score, Risk grade, Debt-to-income (%) | The officer’s review queue; the committee’s risk filter |
| Script: branch → officer | Loan officer | “Loan officer” filter: each officer finds their own applications |
| Script: now + 48 hours | Decision due | The review queue, sorted by the nearest deadline |
| The review is not done in time | Over SLA | The “Over SLA” counter on the officer desk |
| The officer’s or committee’s decision | Stage, Decision, Approved amount, Rejection reason | The pipeline counters, “Approved at a lower amount”, “Rejected applications” |
| The signed agreement | Signed (date) | The disbursement queue, oldest first |
And for each form: Step, Round, Handled by, Assignee, Outcome, Due and Completed, shown when you open an application.
Four teams, four dashboards
Section titled “Four teams, four dashboards”Each dashboard is shared with the team that uses it. Every team sees only the rows it’s allowed to see.
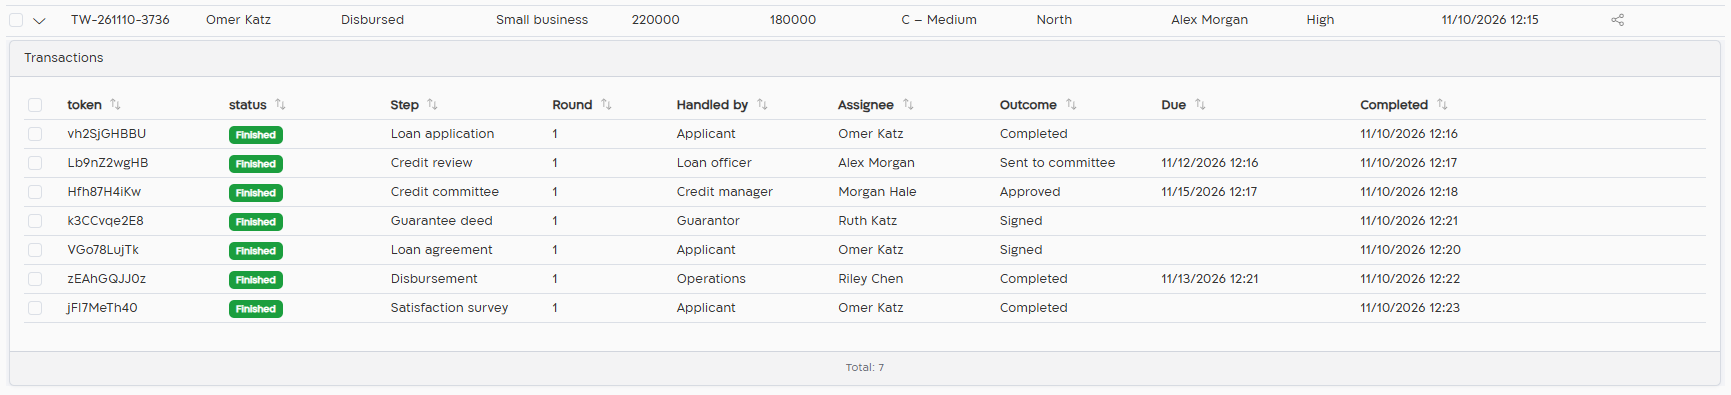
Management: Loan pipeline
Section titled “Management: Loan pipeline”Shared with all project users. One counter for each stage, and every application with its stage, product, amounts, risk grade, branch and officer. Filter by any of them, or search by name.
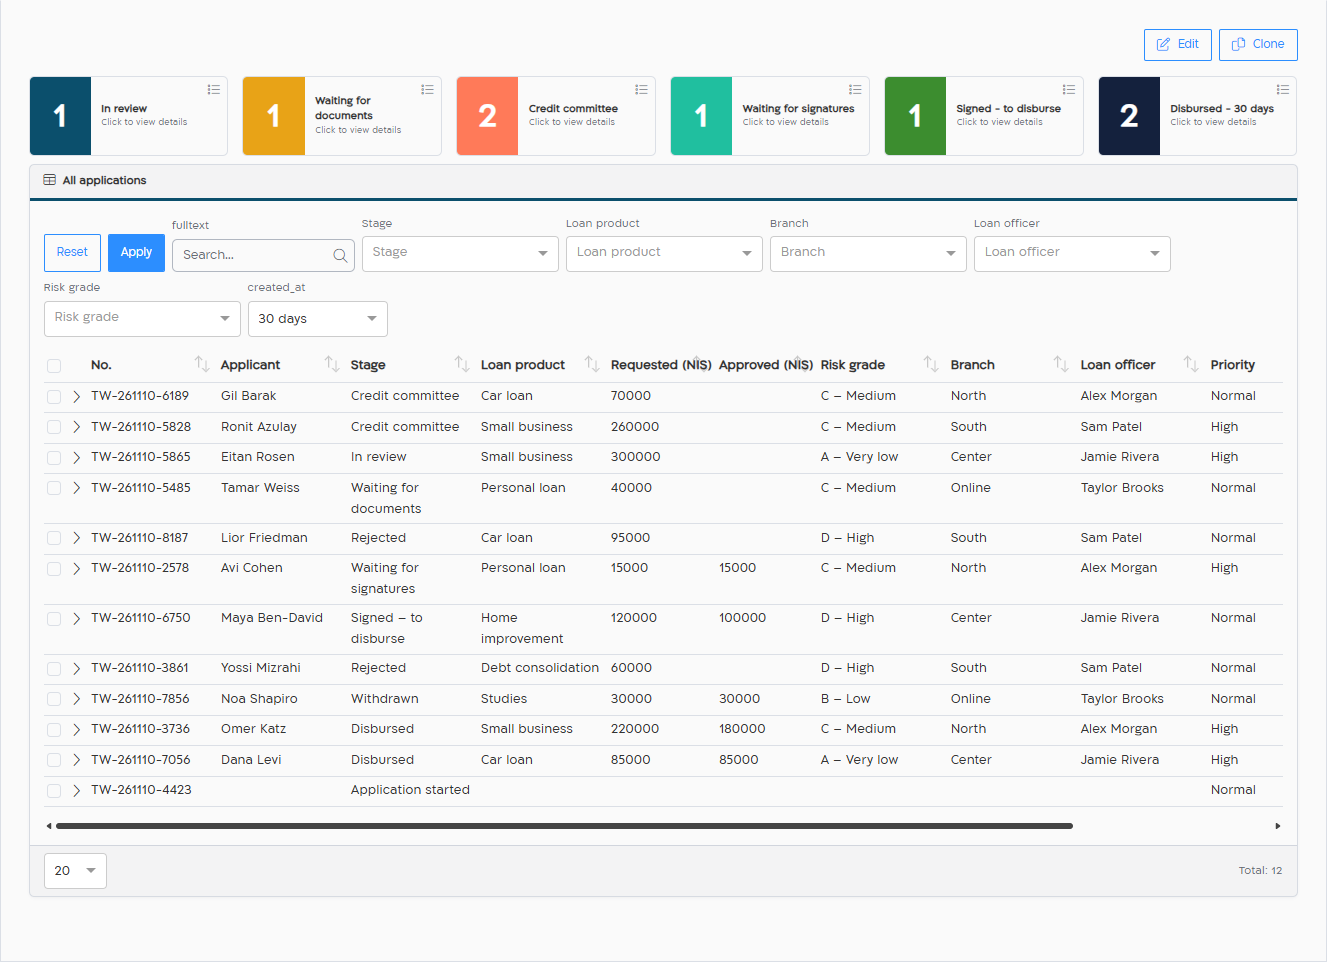
Click › on an application to see all its forms with their own data: who handled each one, the outcome, the due date and when it was done.
Loan officers: Loan officer desk
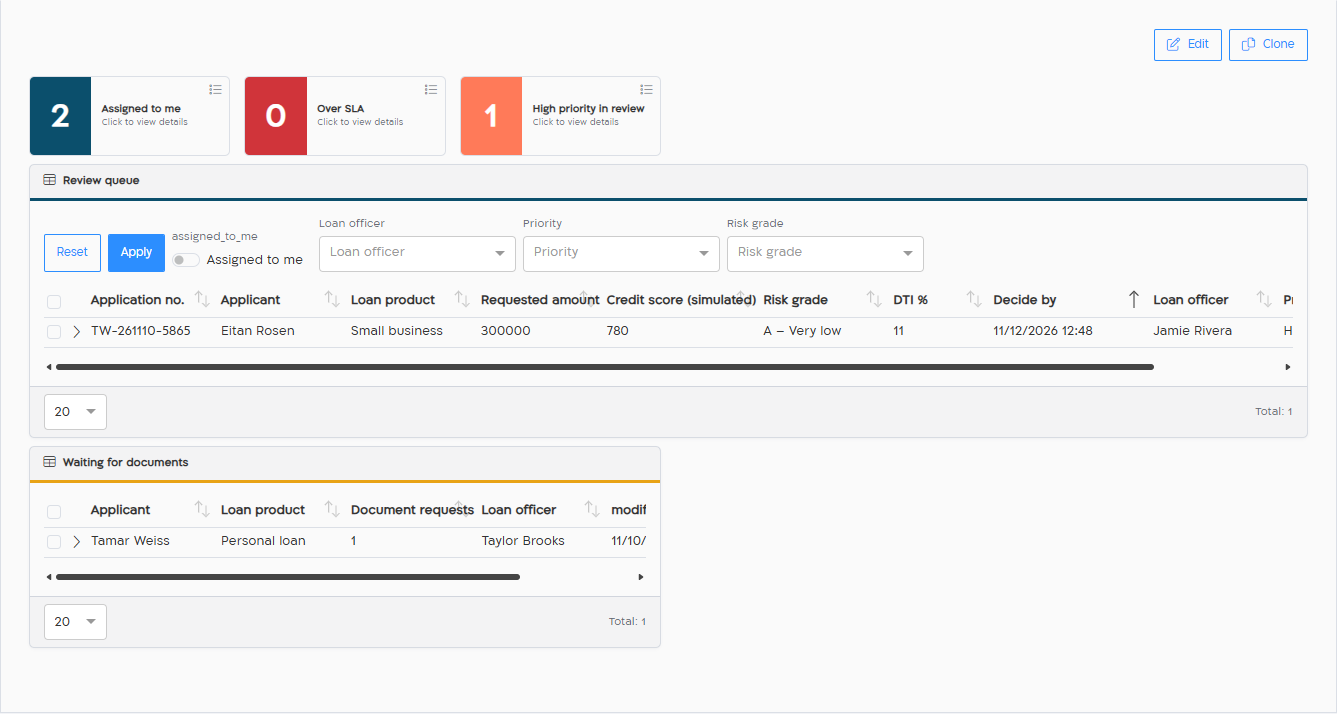
Section titled “Loan officers: Loan officer desk”Shared with the “Loan officers” group. The counters show the applications assigned to the officer, the reviews over the 48-hour SLA and the high-priority ones. The review queue is sorted by the decision deadline. Open Client App opens the credit review form right from the row.
Credit committee
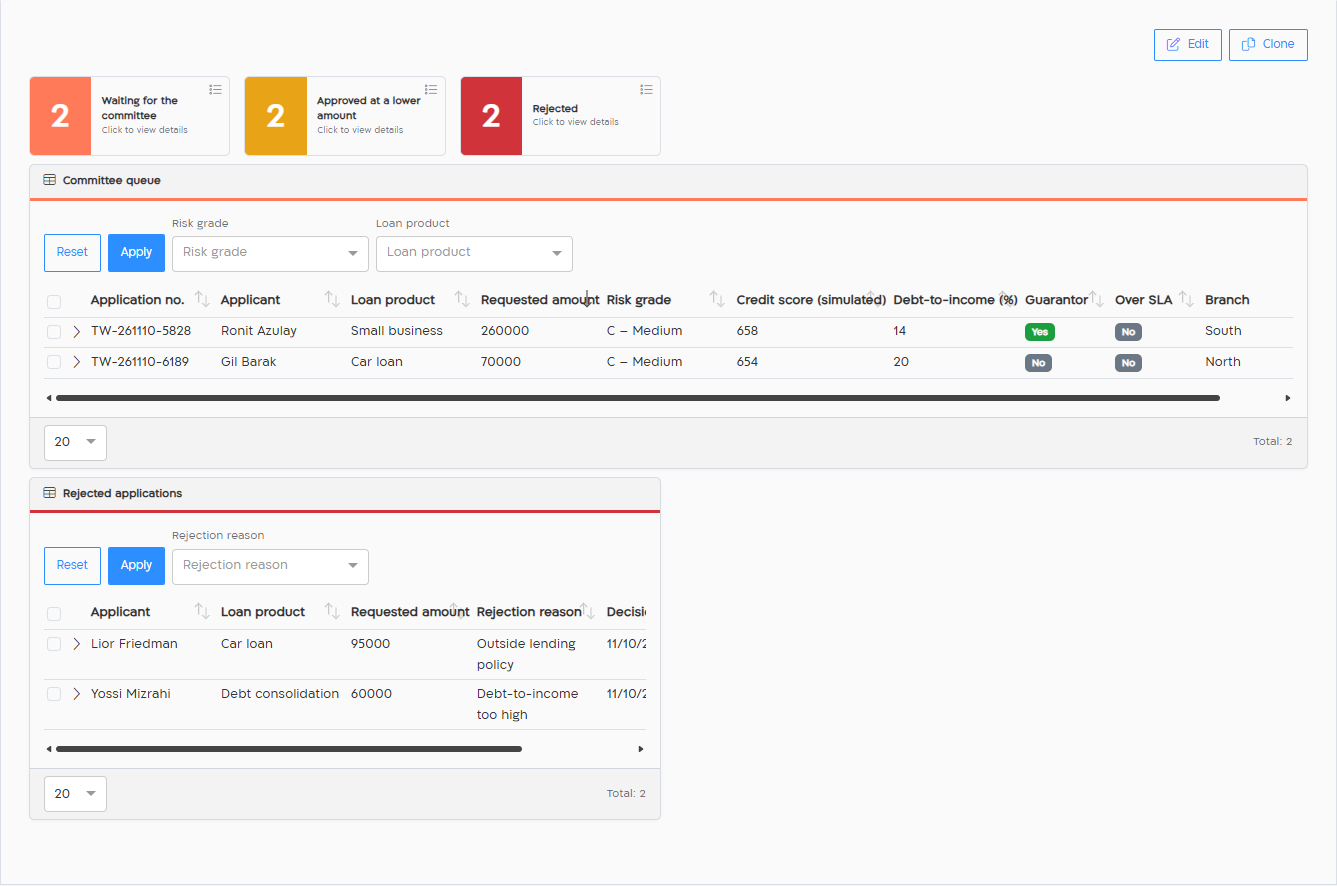
Section titled “Credit committee”Shared with the “Credit committee” group. The applications waiting for the committee, the biggest first, with the score, grade, debt-to-income and guarantor. A second table lists the rejected applications and why.
Operations
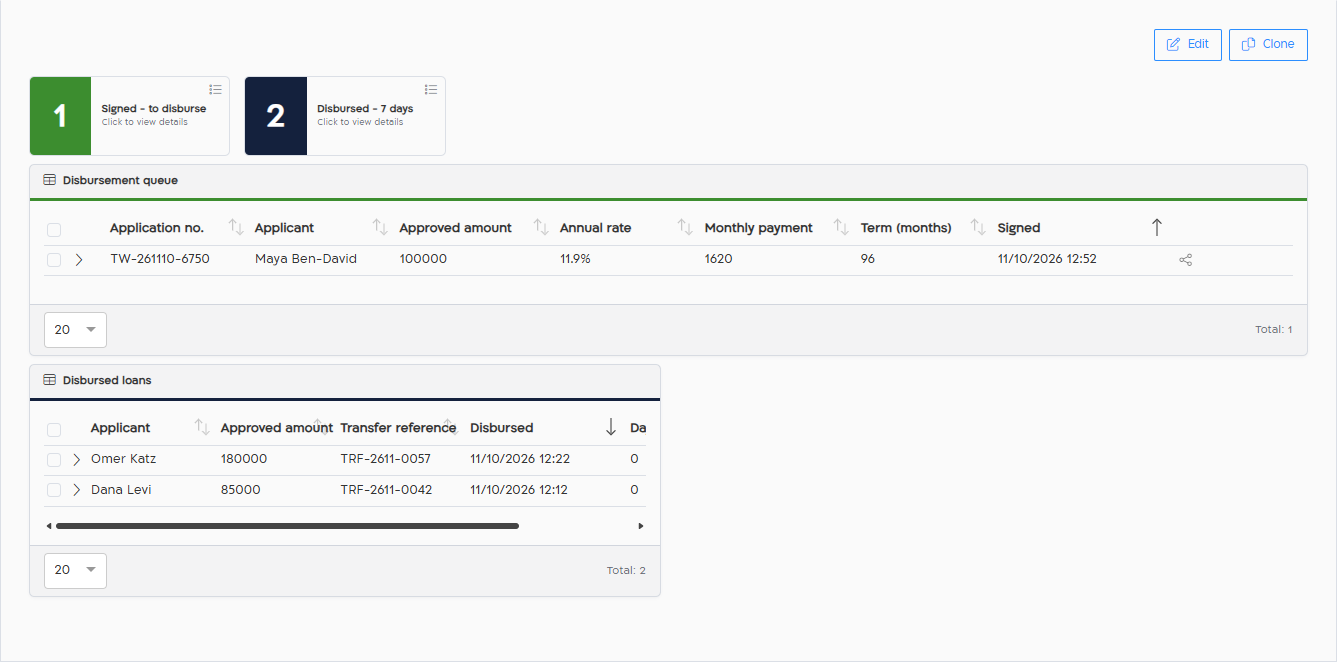
Section titled “Operations”Shared with the “Operations” group. Signed loans waiting for the transfer, oldest first, and the loans disbursed recently with their transfer reference and the days it took from application to cash.
What it takes to build
Section titled “What it takes to build”| Piece | In this example | Where to read |
|---|---|---|
| Custom data | 34 process columns and 10 form columns | Custom data, Prepare your custom data |
| Forms | 8 templates | Templates |
| Workflow | One BPMN workflow with Database Tasks after each step, and on the Form created event of each form | Database Task, Workflows |
| Dashboards | 4 dashboards, 21 generic widgets | Configure a generic widget |
| Teams | 3 user groups | Shared dashboards |