
Generic dashboard
תוכן זה אינו זמין עדיין בשפה שלך.
The Generic Dashboard widget turns your processes into live views for each team: counters, tables, filters, the forms of every case, and actions such as reminders, all from one widget you configure without code.
Each widget shows the project’s processes with the business data you collect along the way: the loan amount from the application form, the risk grade calculated by the workflow, the officer’s decision, the date the money was transferred. That data is the project’s custom data.
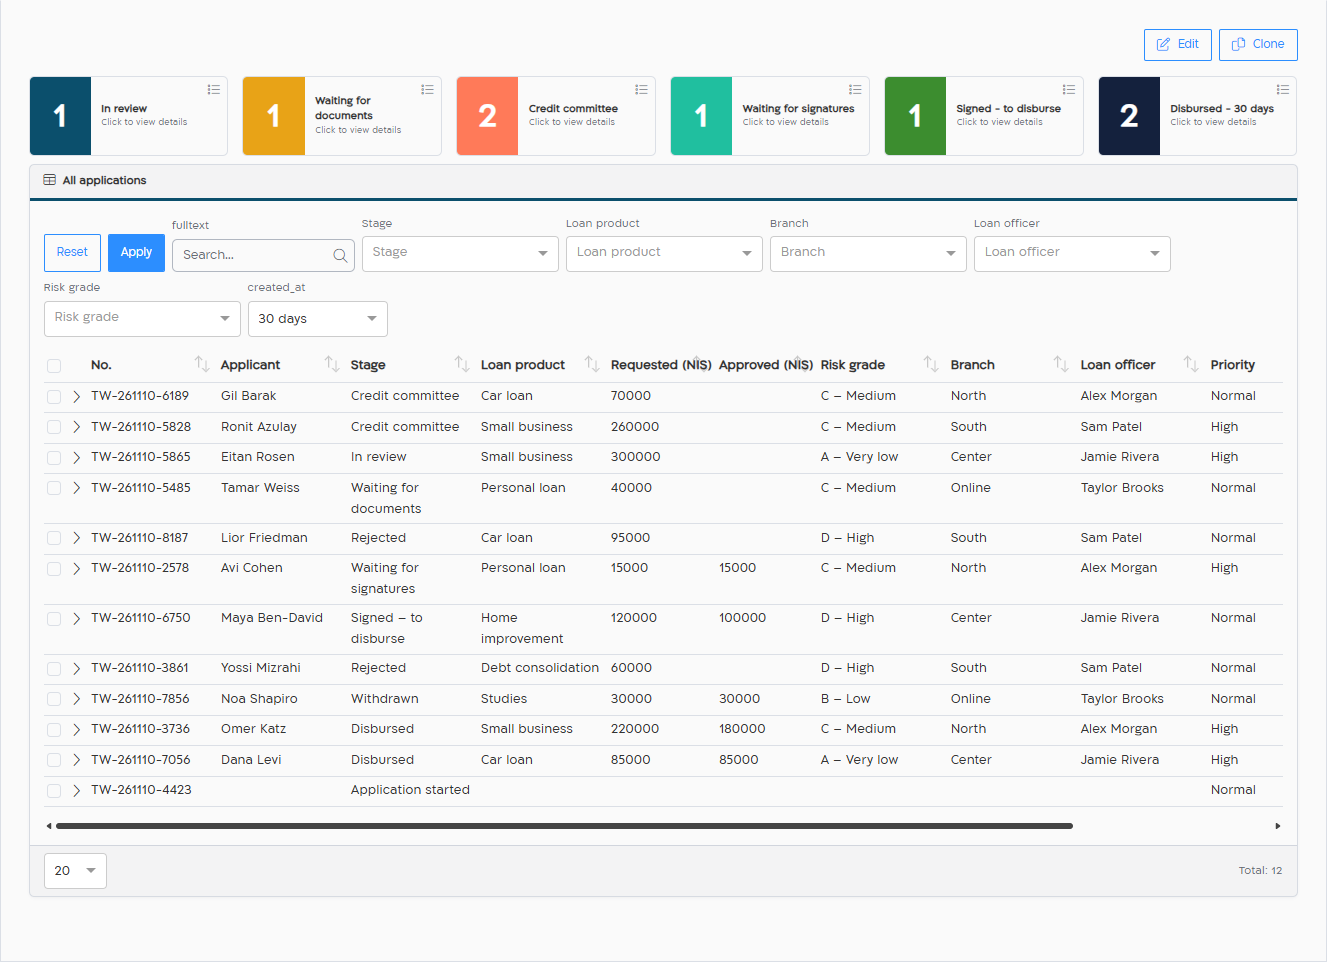
To see a complete example, from the application form through the workflow to five team dashboards, read Example: dashboards for a loan company.
What a widget shows
Section titled “What a widget shows”A generic widget lists rows on two levels:
| Level | Rows | Columns |
|---|---|---|
| Processes / AH_Sessions | The project’s processes (BPMN), and transactions that were sent on their own, not in a workflow. | Built-in process columns, and the custom data of each process. |
| Sessions | The forms (transactions) of one process. Click › at the start of a row to show them. | Built-in transaction columns, and the custom data of each form. |
You choose the columns of each level, their order and their display names, and you choose how the widget looks:
| Display mode | What you get |
|---|---|
| Counter | A colored tile with the number of matching rows. Click it to open the rows in a window. Six counters fit in a row. |
| Table (half width) | A table in half the width of the dashboard. |
| Table (full width) | A table across the whole dashboard. |
Each widget has its own filters: static filters that are always applied and that viewers don’t see, and dynamic filters that viewers change in the widget’s filter bar. Build a row of counters with one static filter each, for example one counter for every stage of your process, and you have a funnel.
Add a generic widget
Section titled “Add a generic widget”You need permission to edit dashboards, and the generic widget must be included in your organization’s plan.
- Open your dashboard and click Edit, or create a dashboard. See Dashboard.
- In Add widget, under Classic, select Generic Dashboard. The widget’s settings open below the other widgets.
- Set the widget on the five tabs: Basic, Columns, Filters, Actions and Sorting. See Configure a generic widget.
- Click Apply, then Save the dashboard.
To change a widget later, edit the dashboard and click the gear icon on the widget.
While the dashboard is in edit mode, widgets don’t load data: counters show 0 and tables show “Data view — exit edit mode to load data”. Save the dashboard to see the data.
Columns you can show
Section titled “Columns you can show”Built-in process columns (level 1):
| Column | What it shows |
|---|---|
status |
The process status: Scheduled, Running, Finished, Expired, Expiring, Canceled, Cancelling or Failed. |
description |
The process name. Set a meaningful name with the Meta Information element, for example “Dana Levi – Car loan – NIS 85,000”. |
created_at, modified_at, expired_at, finished_at |
When the process started, last changed, expires or expired, and finished. |
started_by |
The user who started the process. Empty for processes started from a public link. |
from_public |
Whether the process was started from a public link. |
tags |
The process tags. |
recipient_name, recipient_id |
The recipient of the latest form. |
is_last_session_wait_for, last_session_token, last_session_destination |
Details of the latest form. |
Some columns are used only in filters: template, destination, assigned_to_me and fulltext (the search box).
Built-in transaction columns (level 2): token, status (Running, Finished, Expired, Cancelled or Failed), description, recipient_name, recipient_id, created_at, submitted_at, viewed_at, expired_at, destination, is_seal, from_public, tags and file_description.
Custom data columns carry the label you gave them, and a customer_data badge in the widget settings. Process custom data can be shown, filtered and sorted. Form custom data can be shown and sorted. See Custom data.
Who sees which rows
Section titled “Who sees which rows”A generic widget never shows more than the viewer is allowed to see. The same widget shows different rows to different users:
| User | Rows |
|---|---|
| Organization managers | The processes of all the organization’s projects. |
| Project managers and implementers | All the processes of the project. |
| Agents | The processes they started, and the processes with a form that was sent to their email address, phone or user name. |
| Members of user groups | What the group grants: all the project’s processes, or only processes with certain tags. |
To give each team its own dashboard, share the dashboard with the team’s user group.
Good to know
Section titled “Good to know”- Time window. A widget shows processes changed in the last 365 days, unless one of its filters is on a built-in date column (
created_at,modified_at,expired_atorfinished_at). “Within the last” goes up to 50 days. - Counters count when the dashboard opens. Reload the page to update them.
- Search looks in the description, the recipient name and the name of the user who started the process. It doesn’t search custom data, so put the values people search for, such as the customer’s name, in the process name.
- Rows per page: up to 200. Bulk actions handle up to 50 rows at a time.
- Your filters and sort order are remembered in your browser for each widget.
- Dashboards belong to users, not projects. Your dashboards appear in every project you open, and each widget shows the data of the project selected at the top of the screen.